Learning Objectives
Following this assignment students should be able to:
- practice basic syntax and usage of
forloops- use
forloops to automate function operations- understand how to decompose complex problems
Reading
-
Topics
- Iteration
- Problem decomposition
-
Readings
Lecture Notes
Setup
install.packages(c('dplyr', 'ggplot2', 'readr', 'tidyr'))
download.file("https://datacarpentry.org/semester-biology/data/dinosaur_lengths.csv",
  "dinosaur_lengths.csv")
download.file("https://datacarpentry.org/semester-biology/data/individual_collar_data.zip",
  "individual_collar_data.zip")
download.file("https://datacarpentry.github.io/semester-biology/data/temperature_sensor_data.zip",
  "temperature_sensor_data.zip")
Lecture Notes
Place this code at the start of the assignment to load all the required packages.
library(dplyr)
library(ggplot2)
Exercises
Basic For Loops (20 pts)
1. The code below prints the numbers 1 through 5 one line at a time. Modify it to print each of these numbers multiplied by 3.
numbers <- c(1, 2, 3, 4, 5)
for (number in numbers){
  print(number)
}
2. Write a for loop that loops over the following vector and prints out the mass in kilograms (
mass_kg = 2.2 * mass_lb)mass_lbs <- c(2.2, 3.5, 9.6, 1.2)3. Complete the code below so that it prints out the name of each bird one line at a time.
birds = c('robin', 'woodpecker', 'blue jay', 'sparrow')
for (i in 1:length(_________)){
  print(birds[__])
}
4. Complete the code below so that it stores one area for each radius.
radius <- c(1.3, 2.1, 3.5)
areas <- vector(_____ = "numeric", length = ______)
for (__ in 1:length(________)){
  areas[__] <- pi * radius[i] ^ 2
}
areas
5. Write a for loop that loops over the following vector and stores the height in meters (height_m = height_ft / 3.28) in a new vector. After the for loop make sure to display the vector to the console by running the vectors name on its own line.
height_ft <- c(5.1, 6.3, 5.7, 5.4)6. Complete the code below to calculate an area for each pair of
lengthsandwidths, store the areas in a vector, and after they are all calculated print them out:Expected outputs for Basic For Loopslengths = c(1.1, 2.2, 1.6) widths = c(3.5, 2.4, 2.8) areas <- vector(length = __________) for (i in _____) { areas[__] <- lengths[__] * widths[__] } areasSize Estimates By Name Loop (20 pts)
If
dinosaur_lengths.csvis not already in your working directory download a copy of the data on dinosaur lengths with species names. Load it into R.The following function estimates a dinosaur’s mass based on its length and name of its taxonomic group:
get_mass_from_length_by_name <- function(length, name){
  if (name == "Stegosauria"){
    mass = 10.95 * length ^ 2.64
  }
  else if (name == "Theropoda"){
    mass = 0.73 * length ^ 3.63
  }
  else if (name == "Sauropoda"){
    mass = 214.44 * length ^ 1.46
  }
  else {
    mass = NA
  }
  return(mass)
}
Update this function so that instead of returning
NAwhen none of the species names matches it returnsmass = 25.37 * length ^ 2.49instead.- Use this function and a for loop to calculate the estimated mass for each dinosaur in
dinosaur_lengths, store the masses in a vector, and after all of the calculations are complete show the first few items in the vector usinghead(). - Add the results in the vector back to the original data frame and display first few rows of the new data frame using
head(). - Calculate the mean mass for each
speciesusingdplyr, using the data from you created in (2).
- Use this function and a for loop to calculate the estimated mass for each dinosaur in
Temperature Sensors (20 pts)
You have deployed multiple temperature sensors at different locations to monitor daily temperature patterns. Each sensor records temperature readings every hour for a 24-hour period. The data from each sensor is stored in a separate CSV file with the naming pattern
sensor-X-temp.csvwhere X is the sensor number.- If
temperature_sensor_data.zipis not already in your working directory download the zip file usingdownload.file() - Unzip it using
unzip() - Obtain a list of all of the files with file names matching the pattern
"sensor-"(usinglist.files())
Each file contains two columns:
hour: Hour of the day (0-23)temperature: Temperature reading in Celsius
1. Use a loop to load each sensor data file and calculate the mean temperature for the sensor. Store the results in a vector called
mean_temps. After the loop display the completed vector.2. Create a copy of your code from (1) and modify it to also find the maximum temperature recorded by each sensor and the temperature range (difference between maximum and minimum temperature) for each sensor. Store these values in vectors called
max_temps, andtemp_ranges. After the loop display the completed vectors.3. Create an empty data frame to store all your results and then write a loop to determine the following values for each file and store them in the data frame:
sensor_file: The filename of the sensor datamean_temp: Mean temperature for that sensormax_temp: Maximum temperature recordedmin_temp: Minimum temperature recordedtemp_range: Temperature range (max - min)
4. Challenge (optional) Extend your analysis to find the hour when each sensor recorded its highest temperature. Add a column called
Expected outputs for Temperature Sensorspeak_hourto your results data frame and display the data frame.- If
DNA or RNA Iteration (30 pts)
This is a follow-up to DNA or RNA.
Write a function,
dna_or_rna(sequence), that determines if a sequence of base pairs is DNA, RNA, or if it is not possible to tell given the sequence provided. Since all the function will know about the material is the sequence the only way to tell the difference between DNA and RNA is that RNA has the base Uracil ("u") instead of the base Thymine ("t"). Have the function return one of three outputs:"DNA","RNA", or"UNKNOWN".Copy and paste the following sequence data into your script:
sequences = c("ttgaatgccttacaactgatcattacacaggcggcatgaagcaaaaatatactgtgaaccaatgcaggcg", "gauuauuccccacaaagggagugggauuaggagcugcaucauuuacaagagcagaauguuucaaaugcau", "gaaagcaagaaaaggcaggcgaggaagggaagaagggggggaaacc", "guuuccuacaguauuugaugagaaugagaguuuacuccuggaagauaauauuagaauguuuacaacugcaccugaucagguggauaaggaagaugaagacu", "gauaaggaagaugaagacuuucaggaaucuaauaaaaugcacuccaugaauggauucauguaugggaaucagccggguc")- Use the function you wrote and a
forloop to create a vector of sequence types for the values insequences - Use the function and a
forloop to create a data frame that includes a column of sequences and a column of their types - Use the function and
sapplyto create a vector of sequence types for the values insequences - Use the function, and
dplyrto create a data frame that inclues a column of sequences and a column of their types
Optional: For a little extra challenge make your function work with both upper and lower case letters, or even strings with mixed capitalization
Expected outputs for DNA or RNA Iteration- Use the function you wrote and a
Check That Your Code Runs (10 pts)
Sometimes you think you’re code runs, but it only actually works because of something else you did previously. To make sure it actually runs you should save your work and then run it in a clean environment.
Follow these steps in RStudio to make sure your code really runs:
1. Restart R (see above) by clicking
Sessionin the menu bar and selectingRestart R: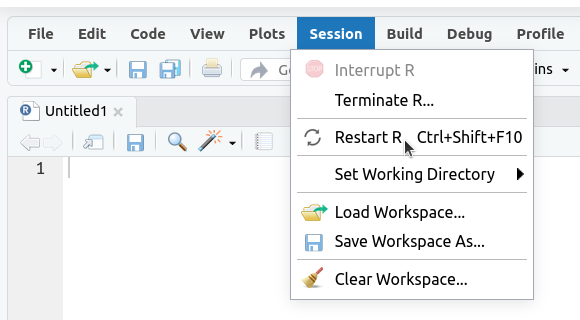
2. If the
Environmenttab isn’t empty click on the broom icon to clear it: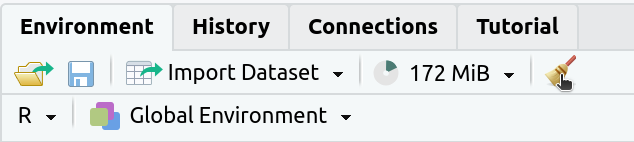
The
Environmenttab should now say “Environment Is Empty”: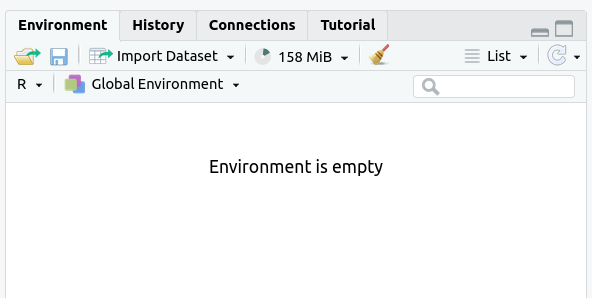
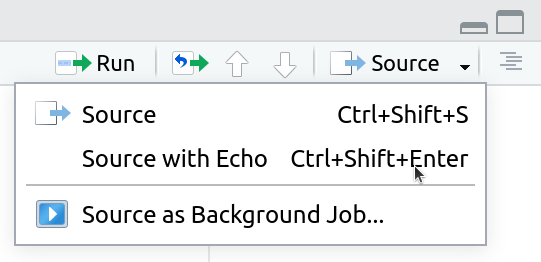
3. Rerun your entire homework assignment using “Source with Echo” to make sure it runs from start to finish and produces the expected results.
4. Make sure that you saved your code with the name
assignmentsomewhere in the file name. You should see the file in theFilestab and the name of the file should be black (not red with an*in the tab at the top of the text editor):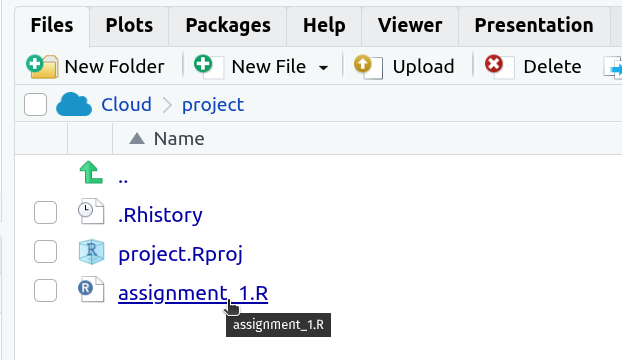

5. Make sure that your code will run on other computers
- No
setwd()(use RStudio Projects instead) - Use
/not\for paths
- No
Multi-file Analysis (Challenge - optional)
You have a satellite collars on a number of different individuals and want to be able to quickly look at all of their recent movements at once. The data is posted daily to a url as a zip file that contains one csv file for each individual: http://www.datacarpentry.org/semester-biology/data/individual_collar_data.zip Start your solution by:
- If
individual_collar_data.zipis not already in your working directory download the zip file usingdownload.file() - Unzip it using
unzip() - Obtain a list of all of the files with file names matching the pattern
"collar-data-.*.txt"(usinglist.files())
-
Use a loop to load each of these files into R and make a line plot (using
geom_path()) for each file withlongon thexaxis andlaton theyaxis. Graphs, like other types of output, won’t display inside a loop unless you explicitly display them, so you need put yourggplot()command inside aprint()statement. Include the name of the file in the graph as the graph title usinglabs(). -
Add code to the loop to calculate the minimum and maximum latitude in the file, and store these values, along with the name of the file, in a data frame. Show the data frame as output.
If you’re interested in seeing another application of for loops, check out the code used to simulate the data for this exercise using for loops.
Expected outputs for Multi-file Analysis- If
Cocili Data Exploration (Challenge - optional)
Understanding the spatial distribution of ecological phenomena is central to the study of natural systems. A group of scientists has collected a dataset on the size, location, and species identify of all of the trees in a 4 ha site in Panama call “Cocoli”.
Download the Cocoli Data and explore the following spatial properties.
- Make a single plot showing the location of each tree for all species with
more than 100 individuals. Each species should be in its own subplot (i.e.,
facet). Label the subplots with the genus and species names, not the species
code. Scale the size of the point by its stem diameter (use
dbh1) so that larger trees display as larger points. Have the code save the plot in afiguresfolder in your project. - Basal area is a common measure in
forest management and ecology. It is the sum of the cross-sectional areas of
all of the trees occuring in some area and can be calculated as the sum of
0.00007854 * DBH^2 over all of the trees. To look at how basal area varies
across the site divide the site into 100 m^2 sample regions (10 x 10 m cells)
and determining the total basal area in each region. I.e., take all of the
trees in a grid cell where x is between 0 and 10 and y is between 0 and 10
and determine their basal area. Do the same thing for x between 0 and 10 and
y between 10 and 20, and so on. You can do this using two “nested” for loops
to subset the data and calculate the basal area in that region. Make a plot
that shows how the basal area varies spatially. Since the calculation is for
a square region, plot it that way using
geom_tile()with the center of the tile at the center of the region where basal area was calculated. Have the code save the plot in afiguresfolder in your project.
- Make a single plot showing the location of each tree for all species with
more than 100 individuals. Each species should be in its own subplot (i.e.,
facet). Label the subplots with the genus and species names, not the species
code. Scale the size of the point by its stem diameter (use
Length of Floods (Challenge - optional)
You are interested in studying the influence of the timing and length of small scale flood events on an ecosystem. To do this you need to determine when floods occurred and how long they lasted based on stream gauge data.
Download the stream guage data for USGS stream gauge site 02236000 on the St. Johns River in Florida. Find the continuous pieces of the time-series where the stream level is above the flood threshold of 2.26 feet and store the information on the start date and length of each flood in a data frame.
Expected outputs for Length of Floods