Learning Objectives
Following this assignment students should be able to:
- understand the basic rules of tidy data
- implement quality control for data entry in spreadsheets
- know how to make messy data tidy using tidyr
Reading
Lecture Notes
Exercises
Improving Messy Data (20 pts)
A lot of real data isn’t very tidy, mostly because most scientists aren’t taught about how to structure their data in a way that is easy to analyze.
Download an untidy version of some of the Portal Project data, which includes information on the site, date, species identification, weight and sampling plot (within the site) for some small mammals.
Think about what could be improved about this data and write down answers to the following questions:
-
Describe five things about this data that are not tidy and how you could fix each of those issues.
-
Could this data easily be imported into a programming language or a database in its current form?
-
Do you think it’s a good idea to enter the data like this and clean it up later, or to have a good data structure for analysis by the time data is being entered? Why?
-
Data entry validation in Excel (20 pts)
Create a spreadsheet in Excel for data entry. It should have five columns: Date, Site, Species, Mass, and Length.
Set the following data validation criteria to prevent invalid data from getting entered:
- The Date column should be set so that it doesn’t convert dates to other formats.
- Use data validation so that Site can only be one of the following
A1,A2,B1,B2. Set the error message on this validation criteria to provide information on what the valid values are. - Use data validation so that Species can only be one of the following
Dipodomys spectabilis,Dipodomys ordii,Dipodomys merriami. Set the error message on this validation criteria to provide information on what the valid values are. - Use data validation so that Mass can only be a decimal greater than or equal to zero but less than or equal to 500. Set the error message on this validation criteria to provide information on what the valid values are.
- Length should be an integer (i.e., a whole number) between 1 and 10. Set the error message on this validation criteria to provide information on what the valid values are.
Check that the validation rules and data formating are working, but do not include any entered data in the final file.
Save this file as
Expected outputs for Data entry validation in Exceldata_entry_form.xlsx.Clean Up Untidy Data (20 pts)
A lot of real data isn’t very tidy, mostly because most scientists aren’t taught about how to structure their data in a way that is easy to analyze.
Download an untidy version of some of the Portal Project data, which includes information on the data, species identification, weight and sampling plot for some small mammals.
Convert the data into a more tidy format.
Expected outputs for Clean Up Untidy DataTree Biomass (30 pts)
Estimating the total amount of biomass (the total mass of all individuals) in forests is important for understanding the global carbon budget and how the earth will respond to increases in carbon dioxide emissions. We can estimate the mass of a tree based on its diameter.
There are lots of equations for estimating the mass of a tree from its diameter, but one good option is the equation:
Mass = 0.124 * Diameter2.53
where
Massis measured in kg of dry above-ground biomass andDiameteris in cm DBH (Brown 1997).We’re going to estimate the total tree biomass for trees in a 96 hectare area of the Western Ghats in India. The data needs to be tidied before all of the tree stems can be used for analysis. f If the
Macroplot_data_Rev.txtis not already in your working directory download a copy.- Use
pivot_longer()to create a longer data frame with one row for each measured stem. Use dplyr’sfilterfunction to remove all of the girths that are zero. Store this longer data frame in a variable and also display it. - Write a function that takes a vector of tree diameters as an argument and
returns a vector of tree masses using the equation above. Test it usingmass_from_diameter(22). - Stems are measured in girth (i.e., circumference) rather than diameter.
Write a function that takes a vector of circumferences as an argument
and returns a vector of diameters (
diameter = circumference / pi). Test it usingdiameter_from_circumference(26). - Use the two functions you’ve written to and dplyr to add a
masscolumn to your longer data frame. Store this data in a variable and display it. - Estimate the total biomass by summing the mass of all of the stems in dataset.
separate()theSpCodecolumn intoGenusCodeandSpEpCodecolumns and then usegroup_byandsummarizeto the total biomass for each uniqueGenusCode.- Use ggplot to make a histogram of the
diametervalues. Make the x label"Diameter [cm]and the y label"Number of Stems"
- Use
Check That Your Code Runs (10 pts)
Sometimes you think you’re code runs, but it only actually works because of something else you did previously. To make sure it actually runs you should save your work and then run it in a clean environment.
Follow these steps in RStudio to make sure your code really runs:
1. Restart R (see above) by clicking
Sessionin the menu bar and selectingRestart R: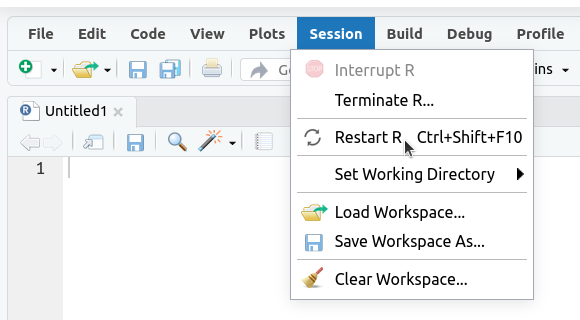
2. If the
Environmenttab isn’t empty click on the broom icon to clear it: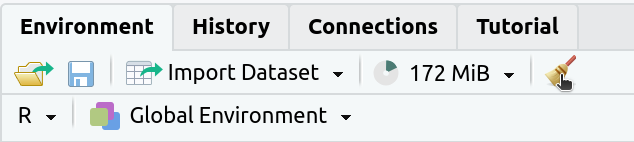
The
Environmenttab should now say “Environment Is Empty”: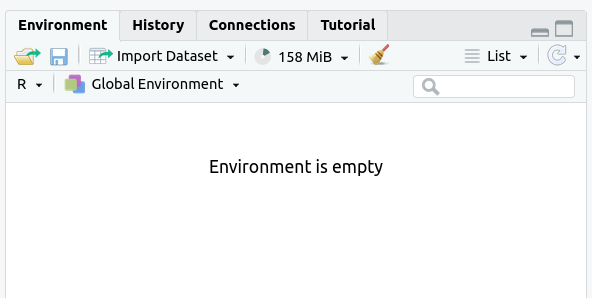
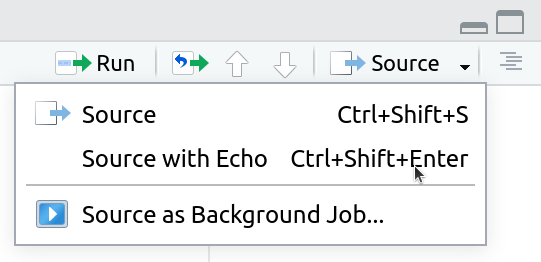
3. Rerun your entire homework assignment using “Source with Echo” to make sure it runs from start to finish and produces the expected results.
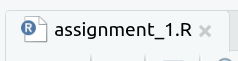
4. Make sure that you saved your code with the name
assignmentsomewhere in the file name. You should see the file in theFilestab and the name of the file should be black (not red with an*in the tab at the top of the text editor):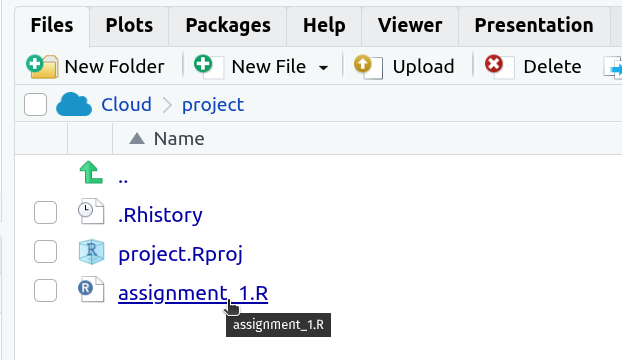
5. Make sure that your code will run on other computers
- No
setwd()(use RStudio Projects instead) - Use
/not\for paths
- No